Along with many of my countrymen, I spent Wednesday night watching UK MPs vote ‘No’ to a series of potential Brexit options, and then read analysis of how different individuals and parties had votes on various websites.
While being very interesting, all the analysis felt very tabular to me, and I was curious whether we could learn anything new by putting the data into a graph.
Getting the data
I searched around a bit to try and find the data behind the votes, and although there is an official record, I found that the Guardian’s How your MP voted table was the easiest to work with.
Guardian Voting Table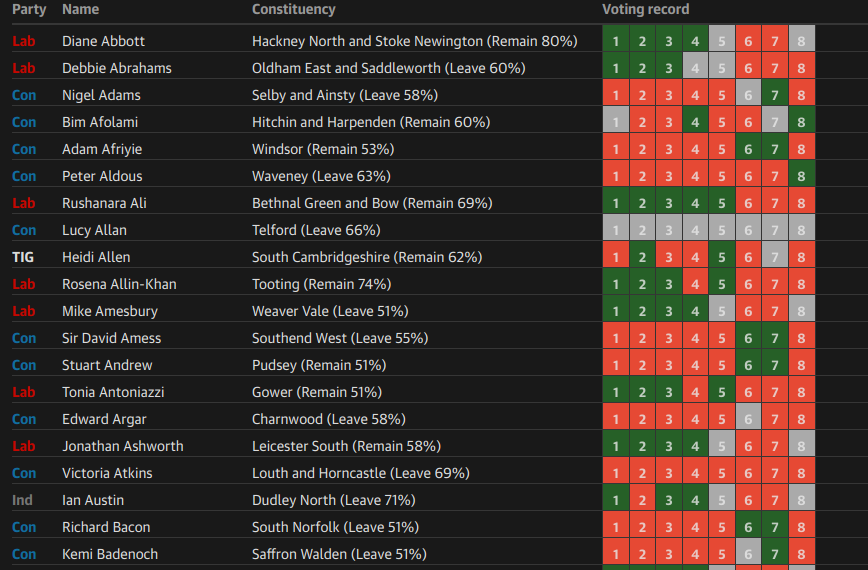
I wrote a scraper that puts this data into CSV files that we can import into Neo4j using the LOAD CSV tool.
You can can find the scrapper and the raw CSV files in the mneedham/graphing-brexit GitHub repository. Below is a sample of one of the files:
Importing the data

We can import the data into Neo4j by pasting the following script into the Neo4j Browser. Make sure that you have the multi statement query editor enabled if you’re following along at home.
You’ll also need to make sure that you have the popular APOC library installed, as we use that to create the relationships indicating which way an MP voted.
// Create one node per motion
LOAD CSV WITH HEADERS FROM "https://github.com/mneedham/graphing-brexit/raw/master/data/motions.csv" AS row
MERGE (m:Motion {id: toInteger(row.id)})
SET m.name = row.name;
// Create nodes for each MP and each party and connect them
LOAD CSV WITH HEADERS FROM "https://github.com/mneedham/graphing-brexit/raw/master/data/mps.csv" AS row
MERGE (person:Person {name: row.mp})
MERGE (party:Party {name: row.party})
MERGE (person)-[:MEMBER_OF]->(party);
// Create a relationship between each MP and each motion
LOAD CSV WITH HEADERS FROM "https://github.com/mneedham/graphing-brexit/raw/master/data/votes.csv" AS row
MATCH (person:Person {name: row.person})
MATCH (motion:Motion {id: toInteger(row.motionId)})
CALL apoc.create.relationship(person, row.vote, {}, motion)
YIELD rel
RETURN rel;
We can see the schema of our graph by executing the CALL db.schema() command:

Analysing the data
Now that we’ve got the data loaded, let’s analyse it. We’ll start by with an overview of the total counts for and against different motions. We can do this by running the following query:
MATCH (motion:Motion)Total votes for each motion
RETURN motion.name,
size((motion)<-[:FOR]-()) AS for,
size((motion)<-[:AGAINST]-()) AS against
ORDER BY motion.id
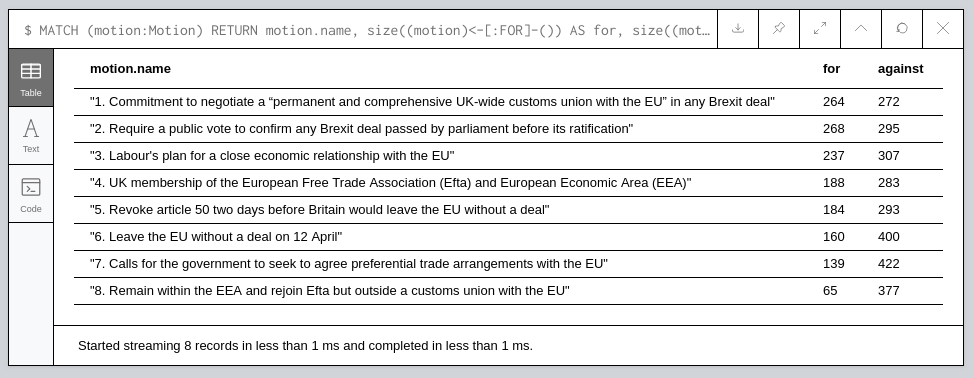
For those that know these numbers well, you’ll notice that some of them are off by one. This is because the Guardian table seems to be missing one MP! I’m not sure who it is, but if you spot it let me know and I’ll update the CSV files.
What else can we discover from the data?
47 people didn’t vote for anything
MATCH (person:Person)-->(party:Party)
WHERE not((person)-[:FOR]->()) AND not ((person)-[:AGAINST]->())
RETURN party.name, count(*) AS count
ORDER BY count DESC

Many of those were cabinet members in the Conservative Party
MATCH (person:Person)Ain’t nobody got time to vote
WHERE not((person)-[:FOR]->()) AND not ((person)-[:AGAINST]->())
MATCH path = (person)-->(:Motion)
WHERE (:Party {name: "Con"})<--(person)
RETURN path
LIMIT 50

Did any Conservatives vote for Labour’s plan?
MATCH path = (:Motion {id: 3})<-[:FOR]-()-[:MEMBER_OF]->(:Party {name: "Con"})
RETURN path

Just the one!
Visualising the data with Neo4j Bloom
After writing a few more Cypher queries, I became curious whether we could do any visual analysis, so I opened up Neo4j Bloom.
Two of the most vocal people for leaving the EU are Boris Johnson and Jacob Rees-Mogg, and by entering the search phrase Boris Johnson Motion Jacob Rees-Mogg , we get the BoRees Star below:
The BoRees Star
As we can see, they voted the same way for each of the motions.
Finding similar voters using Graph Algorithms
After comparing a few more MPs like this, I wanted to try and automate the process, a problem that is perfect for the similarity algorithms in the Neo4j Graph Algorithms Library.
We want to work out how similar the voting patterns were for different people. Initially I thought we could use Jaccard Similarity to do this, but realised it wouldn’t work so well because while two people can be connected to the same motion, that doesn’t mean they are similar — they have may have voted in different ways!
Instead we will think of voting as giving a score to a motion. If you vote:
- FOR then it means you like it. Score of 1
- DID_NOT_VOTE then it means you’re unsure. Score of 0.5
- AGAINST then it means you don’t like it. Score of 0
If we score the votes like this it means that we can use one of the weight based similarity algorithms. The cosine similarity algorithm is commonly used when working out similarity between items in recommendation engines, so we’ll give that one a try.
Whose votes were most similar to those of Boris?
MATCH (p1Party:Party)<-[:MEMBER_OF]-(p1:Person)-[r1]->(m:Motion)
WHERE p1.name = "Boris Johnson"
MATCH (p2Party:Party)<-[:MEMBER_OF]-(p2:Person)-[r2]->(m)
WHERE p2 <> p1
WITH p1, p2, p2Party,
     CASE WHEN type(r1) = "FOR" THEN 5
          WHEN type(r1) = "DID_NOT_VOTE" THEN 0.5
          ELSE 0 END AS r1Score,
     CASE WHEN type(r2) = "FOR" THEN 5
          WHEN type(r2) = "DID_NOT_VOTE" THEN 0.5
          ELSE 0 END AS r2Score
WITH p2.name AS to,
     p2Party.name AS party,
     algo.similarity.cosine(collect(r1Score), collect(r2Score))
     AS similarity
WHERE similarity > 0
RETURN to, party, similarity
ORDER BY similarity DESC

Perhaps not surprisingly, many of the people in the Conservative party voted the same way.
What about if we exclude people in the same party?
MATCH (p1Party:Party)<-[:MEMBER_OF]-(p1:Person)-[r1]->(m:Motion)
WHERE p1.name = "Boris Johnson"
MATCH (p2Party:Party)<-[:MEMBER_OF]-(p2:Person)-[r2]->(m)
WHERE p2 <> p1
WITH p1, p2, p2Party,
     CASE WHEN type(r1) = "FOR" THEN 5
          WHEN type(r1) = "DID_NOT_VOTE" THEN 0.5
          ELSE 0 END AS r1Score,
     CASE WHEN type(r2) = "FOR" THEN 5
          WHEN type(r2) = "DID_NOT_VOTE" THEN 0.5
          ELSE 0 END AS r2Score
WHERE p1Party <> p2Party
WITH p2.name AS to,
     p2Party.name AS party,
     algo.similarity.cosine(collect(r1Score), collect(r2Score))
     AS similarity
WHERE similarity > 0
RETURN to, party, similarity
ORDER BY similarity DESC

Interestingly Kate Hoey is the MP for a constituency that voted 78% remain, yet is voting in a similar way to people who favour leave.

What next?
This does lead the way for some potential future analysis. Can we rank each of those options in terms of how much they favour the leave/remain positions, and work out which MPs are voting in a way most in line with what their constituency votes?
Another thing we could do is create a similarity graph of MPs and then run some community detection algorithms over that.
And if you have a general interest in graph analysis of data, you might enjoy the O’Reilly Graph Algorithms Book that Amy Hodler and I have been working on over the last 9 months. We’re in the final review stage and it should be available in the next few weeks.
You can register to get your free digital copy from the Neo4j webisite, at: neo4j.com/graph-algorithms-book.
O’Reilly Graph Algorithms Book
![]()
Graphing Brexit was originally published in neo4j on Medium, where people are continuing the conversation by highlighting and responding to this story.