Neo4j has a useful procedure called
call apoc.export.graphml.query(
'MATCH (n) OPTIONAL MATCH p = (n)-[r]-(m) RETURN n,r,m',
 'yourPath/exportQuery.graphml', {useTypes:true})
This can allow you to easily visualize your data in yEd by yWorks, a very useful diagramming tool that can handle lightweight models at scale and provide different ways to organize and visual your data which is not offered in the Neo4j Browser. However, the current procedure outputs a fairly barebones graphml file, it only uses one shape (squares) and only 1 color (banana yellow). Despite the usefulness of seeing the graph topology and structure, it is also useful to see the various types of nodes that may be present in the graph as well. However, much of the meta data still gets transferred to the graphml file despite it not being used.
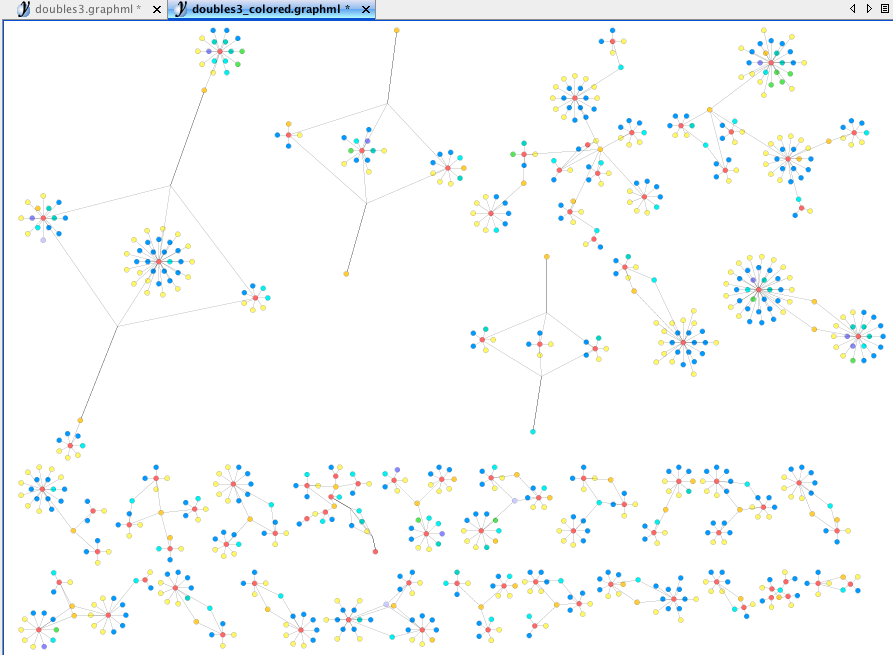
I have made a pretty simple python script that reads in a graphml file and dictionary object which states the shape and color of different node labels in the graph and then colorizes and labels the data with both id keys and shapes. The script can be found here: Squire-Product-Catalog/colorize_graphml.py at master · bsquire0128/Squire-Product-Catalog · GitHub feel free to check it out and use it. Below is an example of the difference between the graphml yEd visualizations.
Before:

After:
Cheers and Happy graphing